
(Note: This article was originally published on October 14, 2021).
One thing that I am always stressing the importance of to new analysts and even some customers who are new to flight data is to make sure that they understand the limitations of the flight data. Flight data is incredibly valuable when it comes to understanding how our aircraft are being flown and it is constantly improving, but it is far from perfect.
One of those limitations is that the data needs to be interpolated on a regular basis. If you are working with flight data, then it is important that you understand what this means and how it can affect your decision making.
We live in a digital world and that includes our flight data. It is recorded digitally (there actually was a time when we had analogue flight recorders, but that’s a blog for another time). What this means is that the data is not “steadily” recorded but rather, it is captured at instances of time.
Some parameters, such as the aircraft accelerations, are recorded relatively frequently – 8 or 16 times a second (hertz – Hz). Other parameters may be recorded much less frequently. Gross weight, for example, if recorded at all, could be recorded only once every minute.
Technically, parameters certainly CAN be recorded more frequently, but the problem becomes one of data storage. The more frequently you record a parameter value, the more storage space it takes up on the recorder (think of a 1 megapixel photo vs a 40 megapixel photo – much more resolution but much larger file size). This makes it a bit of a balancing act for the engineers programming the data acquisition units to ensure that all the required parameters manage to get stored on the recorder at a sample rate that is useful.
I got to experience this first hand when I was working in flight testing. Some of the vibration tests that the team was conducting required some parameters to be sample at very high sample rates – over 10,000 Hz. Once those parameters were programmed in the data acquisition units, it did not leave much room to record any additional parameters. The performance engineers had to be very selective about what other parameters they required for their tests since the vibration data left little additional room on the available storage.
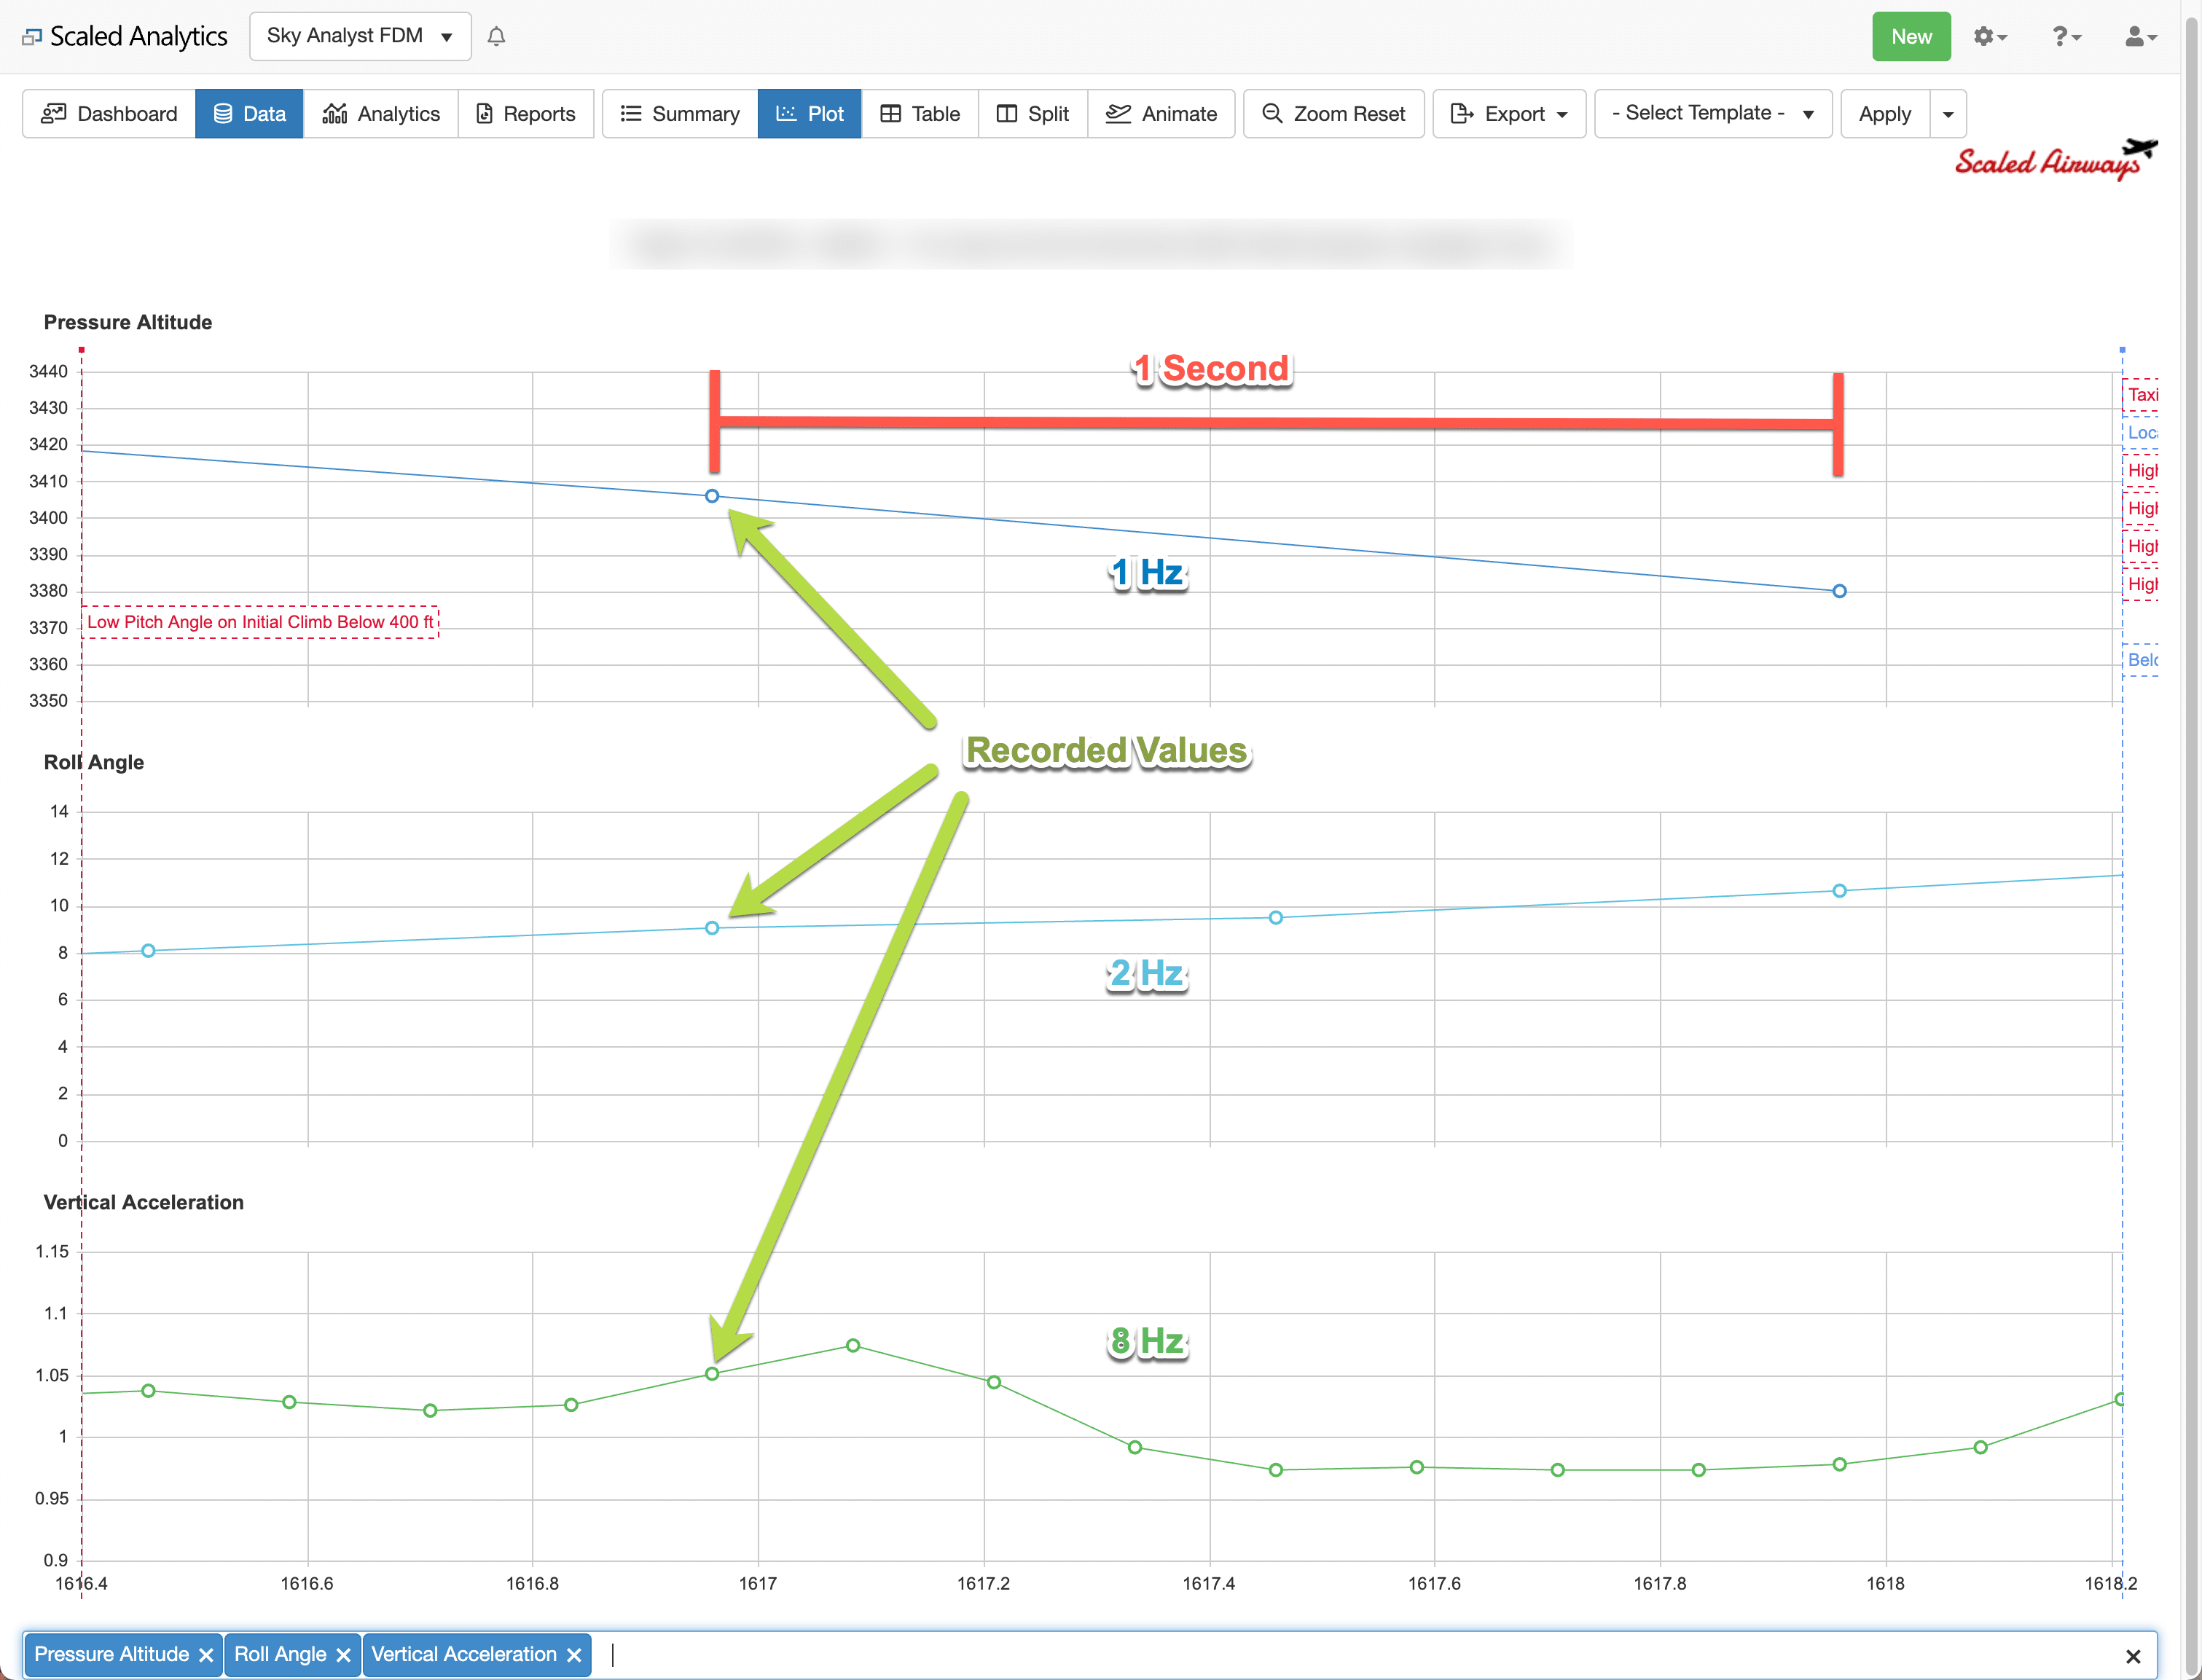
This concept is not terribly difficult to understand, but it is easier to see visually. In the screenshot below (taken from our Sky Analyst FDM system), I have zoomed in on a region of plotted data. In the chart, the circular symbols represent actual recorded data points. I have also sectioned off one second of data.
Here you can see that Pressure Altitude (the top most parameter) is recorded once every second, while Roll Angle is recorded twice per second, or 2 Hz. Vertical Acceleration is recorded at 8 Hz. (Do not count the sample at the end of the 1 second region – that is the beginning of the next second of data.)
This is fairly representative of most modern aircraft recording systems, but sample rates do vary from aircraft to aircraft. The specific sample rates of your data will likely differ from this example, but the concept will be the same.
Referring back to the graph above, the data between recorded points needs to be “filled in” so that we can make better use of it for detecting FDM events and analyzing our flights. We do this by interpolating the data between known points. We represent this in our system as lines connecting the data points, but other systems may represent it differently.
There are many methods for data interpolation and it is beyond the scope of this blog to go through them. The good news is that, for the most part, the software will take care of this for you. And in most cases, that will not be a problem.
But it is very important to understand some of the limits of interpolated data when you are trying to understand your FDM or FOQA events, or if you are investigating a particular flight or incident.
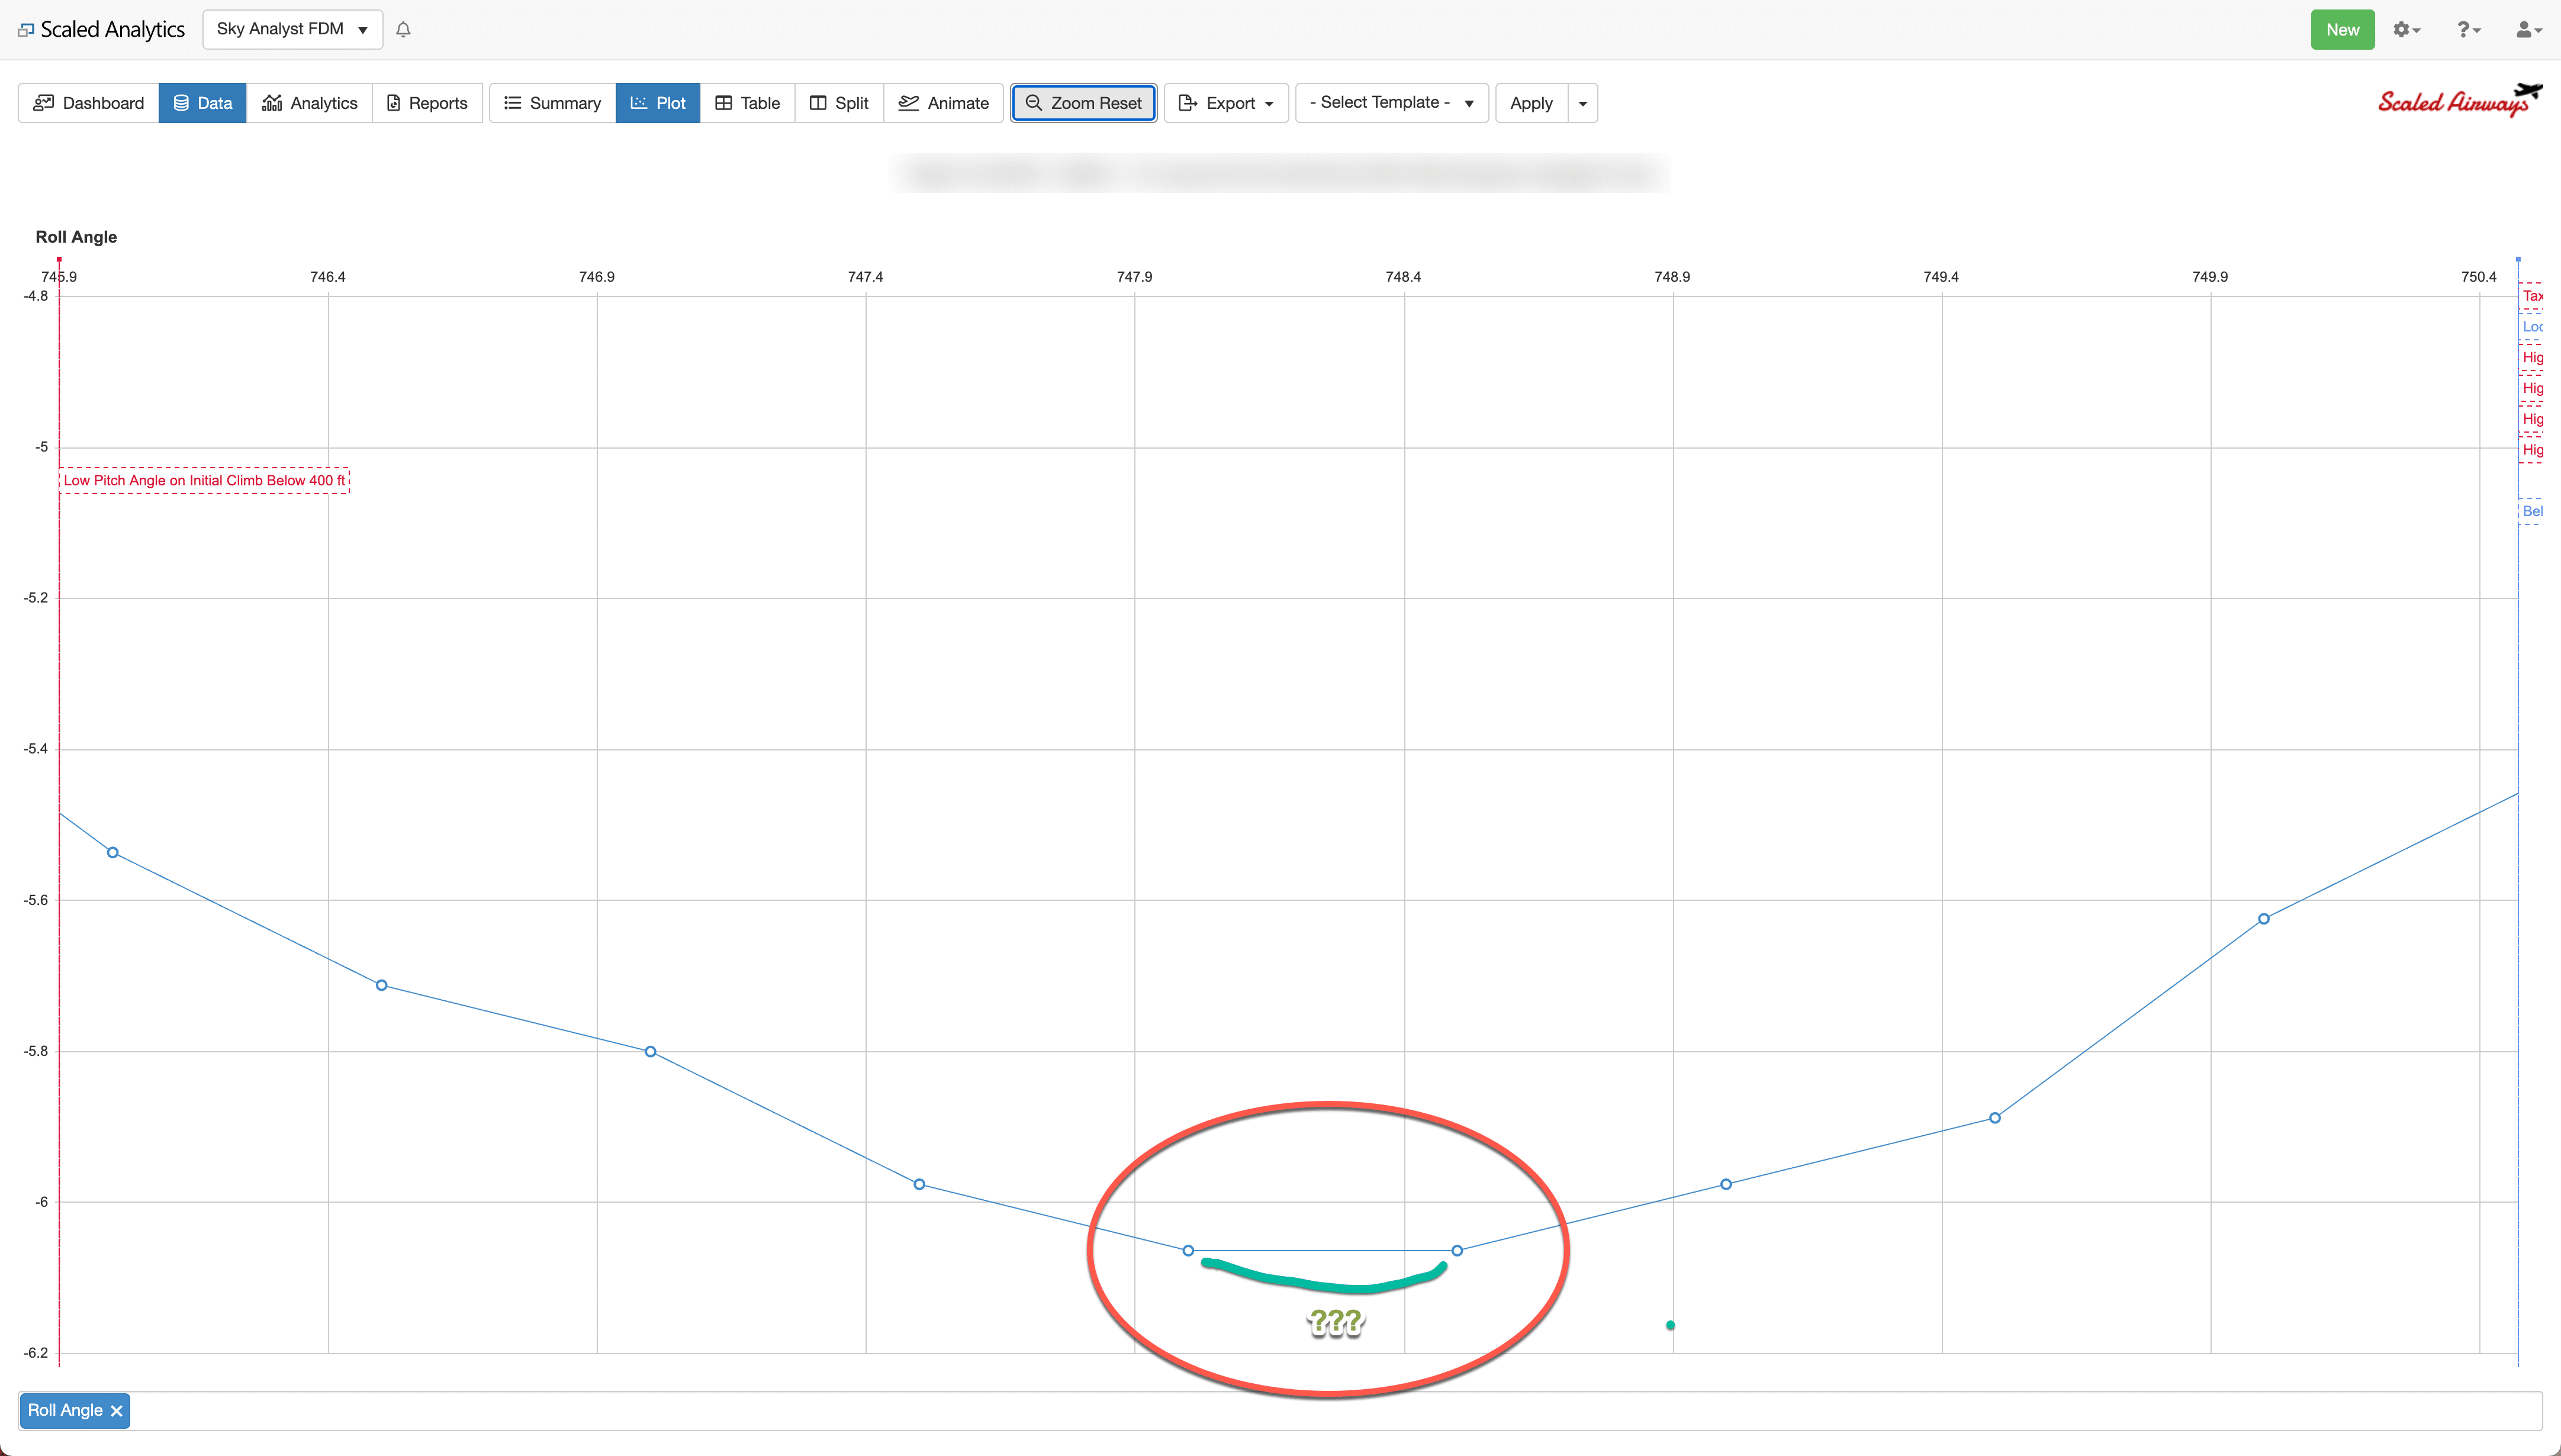
One situation is that the data could under (or over) represent the actual parameter value. In the screenshot below, I have highlighted a region at the peak of an aircraft roll maneuver. A fairly standard interpolation method is used here and the data points are basically “averaged” in this region, so we get the horizontal line in the trace.
However, in reality, what is more likely to have happened is that the aircraft continued to roll for another quarter second, reached its peak, then started to roll back towards wings level. I have tried to represent this possibility with the sketched curve below the trace in the highlighted region.
I say that is more likely, but not necessarily exactly what happened. It IS also possible (but less likely) that the aircraft did stop its roll for half a second as indicated in the data.
There are other interpolation methods that can compensate for this (typically with data smoothing), but those methods run different risks, such as over-smoothing or under-smoothing the data.
I know it is difficult to see in the chart above, but if you look at the roll angle values for this example, we are talking about a very small difference between the recorded roll angles in that region and the most likely ‘peak’ value – perhaps only 0.05 degrees or so.
For the purposes of Flight Data Monitoring and statistical data collection, this is quite acceptable; however, for detailed incident or accident investigation, the flight data analyst may want to spend additional time on a section of data like this, applying different data manipulation techniques to get more “probable” results. What is considered “probable”, though, is based on the Analyst’s own judgement, experience and expertise, along with any additional information available to him or her such as pilot and witness reports, other instrument readings, etc.
Some other examples where the limitations of interpolating flight data need to be considered include:
Identifying Points of Touchdown:
The Air Ground or Weight On Wheels parameters can be very helpful in determining the point of touchdown – something that is regularly monitored in a Flight Data Monitoring program. But these points can be grossly inaccurate depending on how frequently Air Ground is recorded.
Most aircraft record this at a rate of 1 Hz, which is generally acceptable. But keep in mind that at 120 kts, an aircraft travels over 200 ft in a second. If Air Ground is recorded at a rate of once every 4 seconds (or 0.25 Hz), then its use becomes quite limited.
Some software vendors and analysts have claimed some success using accelerations to pinpoint the point of touchdown, but I am skeptical. It is easy to claim that something is working when you do not have test data to back up your claim.
So, if you are evaluating a long landing and are planning on questioning the crew, make sure you have all the details of the data and you fully understand its limitations.
Overweight Landings:
In my experience, this is a fairly rare event but, on many aircraft, gross weight is recorded so infrequently that it deserves mention here.
Gross weight can be recorded as infrequently as once per minute on some aircraft (actually once every 64 seconds). This is typically a reasonable sample rate for a parameter that does not change very often, but if you are looking at an overweight landing event, make sure that you have a reasonable value for the aircraft gross weight.
If you are using a system that does not interpolate the data at all (hopefully there are not many of those on the market any more), then your data could be a minute old. Keep this in mind when performing any analysis – particular that which may affect the airworthiness of the aircraft.
Of course, there are limitless cases where the limitations of interpolated data could become a problem if not fully understood. Software and its algorithms are constantly improving, but there is no magic bullet.
The experience and judgment of the analyst will remain the most important piece of the analysis puzzle. When working with flight data, make sure that you fully understand its limitations, not to mention your own, in order to avoid drawing conclusions that are simply incorrect.

Let’s keep in touch
Sign up to get notified of new blog posts, videos or other news and information related to flight data.

